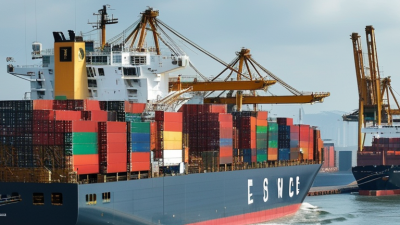
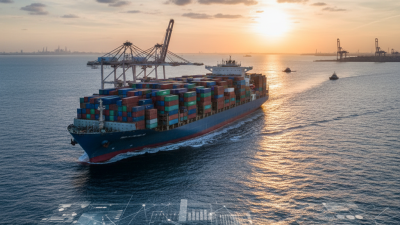
Reducing ocean freight shipping costs in 2026 will require more than requesting a lower carrier rate. Fuel prices, port congestion, equipment shortages, emissions rules, and changing trade routes can quickly alter a shipment’s final cost. A quote that looks attractive on Monday may include costly surcharges by Friday. Experienced logistics teams therefore examine the complete landed cost, not just the base freight charge.
Small operational details often create significant savings. Accurate carton dimensions can prevent unnecessary volumetric charges. Flexible sailing dates may provide access to cheaper services. Consolidating compatible shipments can improve container utilization, especially when pallets leave unused space above them. Contract reviews should also clarify demurrage, detention, documentation, and destination handling fees. Read the fine print.
This guide explores practical methods for controlling ocean freight shipping expenses without sacrificing reliability or compliance. It considers carrier negotiations, shipment planning, route selection, packaging, digital visibility, and supplier coordination. Industry data and operational experience can support better decisions, but no single strategy works for every business. A small importer may benefit from consolidation, while a high-volume exporter may need a tailored annual contract.
Some assumptions may fail. That matters. Costs can rise despite careful planning when weather, labor disruptions, or geopolitical events affect a route. The strongest approach combines measurable savings with realistic risk management. By comparing complete shipment costs and reviewing performance after each move, companies can build a more resilient freight strategy for 2026.
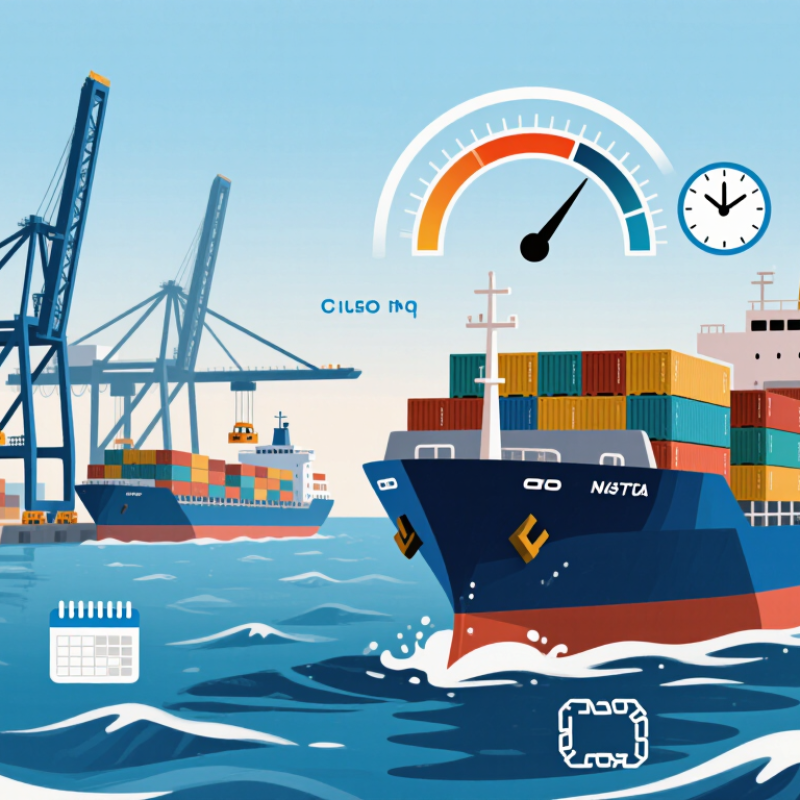
Ocean freight costs in 2026 will depend on more than the quoted ocean rate. Demand, vessel capacity, fuel prices, port congestion, and inland transport all influence the final invoice. UNCTAD’s Review of Maritime Transport 2024 recorded 12.3 billion tons of seaborne trade in 2023, a 2.4% increase. Growing volumes can quickly tighten available container space. However, weak demand may trigger blank sailings and unstable schedules. This is where forecasts often fail.
Fuel remains a major cost driver. Carriers may adjust surcharges when bunker prices change sharply. The International Maritime Organization’s 2023 greenhouse-gas strategy also increases pressure for cleaner fuels and more efficient vessels. These upgrades may raise operating costs before they create savings. Route risks matter too. Canal restrictions, security diversions, and longer sailing distances consume more fuel and equipment time. A cheaper quote can still become expensive.
Tips: Compare the total landed cost, not only the base freight rate. Request separate figures for fuel, security, documentation, terminal, and inland charges. Ship earlier before seasonal peaks. Keep two routing options available. Use accurate cargo forecasts, because sudden booking changes often create avoidable premiums. Review port dwell time monthly. Small delays can become large storage bills. Ataats
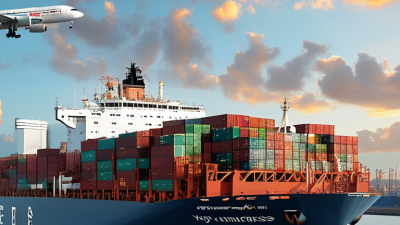
Ocean freight savings in 2026 will depend on choosing the right route, carrier, and service type. UNCTAD’s Review of Maritime Transport 2024 states that ships carry over 80% of global trade by volume. Route selection therefore deserves close attention. A direct service may cost more per container but reduce transshipment delays, handling risks, and storage charges. Conversely, a longer route with one extra transfer can lower the ocean rate while increasing total landed cost.
Cheapest is not always cheapest.
Compare at least three routing options using door-to-door figures. Include bunker surcharges, terminal fees, detention, demurrage, insurance, and expected delay costs. The World Bank’s Logistics Performance Index highlights reliability and timeliness as key logistics outcomes, not just price. In practice, a slightly higher-priced carrier with stable schedules may protect production better than an unreliable low quote. I would still challenge that assumption, because schedule reliability can change by season and trade lane.
Service type also matters. Use standard port-to-port shipping for flexible cargo and predictable demand. Consider slower economy services when inventory can absorb extra days. Choose premium or priority services only for time-sensitive goods. UNCTAD has reported that regional disruptions and vessel rerouting can increase sailing distances, fuel use, and pressure on capacity. Request current transit data, cancellation records, and free-time terms from carriers. Then review performance monthly. Forecasts are useful, but actual shipment history is often less flattering.
Ocean freight savings in 2026 often begin before the booking stage. UNCTAD reports that around 80% of global merchandise trade by volume moves by sea. That makes small packing decisions financially significant. Measure cartons, pallets, and product protection together. A 40-foot high-cube container holds roughly 76 cubic meters, but poor stacking can waste much of it. Use uniform carton sizes, stronger outer boxes, and nestable products where possible. Small gaps matter.
Container planning should reflect real cargo, not optimistic spreadsheets. Place heavy pallets low and keep weight balanced across the floor. Avoid mixing fragile cartons with loose, irregular pieces. Lightweight products may reach the container’s volume limit first, while dense cargo reaches its weight limit. These are different problems. A simple loading simulation can expose unused corners before dispatch. Still, a perfect cube plan rarely survives production changes. Recheck dimensions after final packing.
Shipment consolidation can reduce partial loads and repeated handling. Create a weekly consolidation window for compatible orders, then compare full-container and less-than-container options using total landed cost. Include warehouse labor, storage, documentation, and damage risk. The World Bank’s 2023 Logistics Performance Index covered 139 economies and highlighted the importance of shipment visibility and predictable border processes. Share accurate carton counts and ready dates early. Otherwise, consolidation may create storage charges or missed sailings. Measure it honestly. A cheaper freight rate is not cheaper when cargo waits ten days for one late carton.
Estimated freight-cost reduction from packaging optimization, container utilization, and shipment consolidation
Optimizing cargo packaging can reduce dimensional waste, better container loading can increase usable cubic capacity, and consolidating compatible shipments can lower the cost per shipment. The percentages are planning benchmarks and should be validated against actual routes, cargo dimensions, carrier rates, and destination charges.
How to Reduce Ocean Freight Shipping Costs in 2026?
Customs, documentation, port, and handling fees can quietly erode shipping margins. In practice, a missing tariff code may delay a container and trigger storage charges. A clean commercial invoice, accurate packing list, and consistent product descriptions reduce avoidable corrections. The World Trade Organization estimates that full Trade Facilitation Agreement implementation could lower global trade costs by 14.3%. That is significant, but results vary by country and cargo type.
Tips: Build a document checklist before cargo pickup. Confirm tariff classification, origin details, weights, and consignee information. Use electronic submissions where authorities accept them. Ask the forwarder for a complete fee schedule, including terminal handling, documentation, security, and amendment charges. Small fees multiply quickly.
Port planning also matters. UNCTAD’s Review of Maritime Transport 2024 reported continuing schedule disruption and freight-rate volatility. A late container may face demurrage, storage, or an extra handling move. Compare port cut-off times, free-time terms, and inland transfer options before booking. Consolidating compatible shipments can reduce handling, but it may increase coordination risk. That trade-off deserves a real calculation. The World Bank’s Logistics Performance Index 2023 also shows wide differences in customs and logistics performance between economies. Do not assume the cheapest port is the cheapest route. A cheaper rate can become expensive after delays, re-documentation, and terminal charges. Track these costs shipment by shipment. Perfect forecasting is unrealistic. Better records still improve the next decision.
| Cost Dimension | Typical Cost Basis | Baseline Planning Cost | Practical Cost-Control Action | Target Cost After Optimization | Potential Saving | Key 2026 KPI |
|---|---|---|---|---|---|---|
| Customs duties and import taxes | Transaction value, tariff classification, origin, and local tax rules | USD 8,000 | Use accurate HS classification, validate preferential origin eligibility, and prepare valuation evidence before shipment. | USD 7,200 | 10.0% | Duty correction rate below 1% |
| Customs brokerage and clearance | Entry filing, declarations, inspections, and broker service fees | USD 1,250 | Consolidate repetitive entries where legally permitted, submit complete data electronically, and use pre-arrival clearance. | USD 1,000 | 20.0% | First-pass clearance rate above 98% |
| Shipping documentation | Commercial invoice, packing list, bill of lading, certificates, and amendments | USD 750 | Standardize templates, use a single data source, verify consignee details, and reduce bill-of-lading amendments. | USD 525 | 30.0% | Documentation error rate below 2% |
| Demurrage and detention | Container time beyond free time at terminal or outside the terminal | USD 2,400 | Track free-time expiry, pre-book delivery appointments, arrange customs release early, and return equipment promptly. | USD 1,200 | 50.0% | Containers incurring charges below 3% |
| Port terminal handling | Terminal handling, gate, security, scanning, and local port charges | USD 1,800 | Compare total landed cost by port, avoid unnecessary transshipment, and negotiate transparent local-charge schedules. | USD 1,530 | 15.0% | Unplanned local charges below 2% |
| Inland drayage and port access | Container pickup, delivery, chassis, tolls, fuel, and waiting time | USD 3,200 | Use round-trip planning, coordinate warehouse receiving windows, and reduce truck idle and empty-return miles. | USD 2,560 | 20.0% | Truck utilization above 85% |
| Cargo handling and warehousing | Loading, unloading, palletizing, storage, and cargo rework | USD 1,600 | Improve carton and pallet utilization, schedule labor against vessel arrivals, and prevent avoidable re-handling. | USD 1,280 | 20.0% | Cube utilization above 90% |
| Freight booking and container utilization | Ocean freight, equipment type, load factor, and shipment frequency | USD 12,000 | Consolidate compatible orders, improve container fill, compare weekly all-in quotations, and select the suitable service route. | USD 10,200 | 15.0% | Average container fill above 85% |
| Cargo insurance and claims administration | Insured value, commodity risk, packaging, and claims handling | USD 600 | Match coverage to cargo risk, strengthen packaging controls, and maintain timestamped shipment records. | USD 510 | 15.0% | Damage and claims ratio below 0.5% |
| Illustrative planning total per comparable shipment | USD 31,600 | Combined customs, documentation, port, handling, inland, and freight controls | USD 26,005 | 17.7% | Review monthly against actual invoices | |
In 2026, ocean freight savings rarely come from one dramatic rate cut. They come from repeated operational adjustments. Track each shipment from booking to final delivery. Record quoted cost, actual invoice, transit time, rollovers, detention, demurrage, and cargo damage. A simple weekly dashboard exposes patterns that monthly averages hide. Patterns matter. A lane may look cheap until three late containers create storage charges.
Set a baseline by lane, sailing schedule, container type, and port pair. Compare actual performance against that baseline every week. Measure cost per container and cost per cubic meter. Also track schedule reliability and document accuracy. A low rate is not a saving if cargo misses a production window. Ask operations teams to explain exceptions, not just approve spreadsheet changes. Their notes often reveal poor cutoff planning or unrealistic booking volumes. Keep it measurable.
Use the data to adjust routing, sailing frequency, booking lead time, and safety stock. Test one change at a time when possible. We once shifted volume to a cheaper sailing and overlooked its longer inland connection. The invoice improved, but customer delays increased. That decision needed a wider review. Forecasts also fail during port congestion, weather disruptions, and sudden demand changes. Keep an exception log, update assumptions, and retain invoices for audit checks. Review each adjustment with finance, logistics, and compliance staff. Record its owner, deadline, and expected saving.