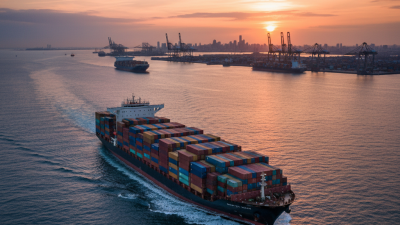
Why choose global logistics solutions when markets remain unpredictable? The answer begins with visibility, coordination, and disciplined execution. The World Bank’s Logistics Performance Index 2023 evaluated 139 economies and highlighted persistent gaps in customs, infrastructure, and shipment timeliness. These gaps are not abstract. A delayed container can leave a warehouse dock idle, a production line waiting, and customers checking tracking pages repeatedly.
Global logistics solutions connect freight forwarding, inventory planning, customs documentation, warehousing, and last-mile delivery through one operating framework. The UNCTAD Review of Maritime Transport 2023 reports that ships carry over 80% of world merchandise trade by volume. A small disruption at a major port can therefore affect manufacturers thousands of miles away. As Frank Appel, former CEO of Deutsche Post DHL Group, observed, “Logistics is the backbone of global trade.” The statement is simple. Its implications are not.
Experienced providers use shipment data, carrier networks, route analysis, and contingency planning to reduce uncertainty. They can compare transit times, monitor temperature-sensitive cargo, and flag exceptions before a missed delivery becomes a costly complaint. Yet no provider removes every disruption. That assumption deserves scrutiny. Data can be incomplete, forecasts can fail, and local knowledge still matters.
The strongest partner combines technology with accountable people. It explains trade-offs clearly, protects shipment records, and measures results against service-level commitments. For businesses seeking resilient growth, global logistics solutions are not merely transportation services. They are a practical operating system for moving products safely, lawfully, and predictably across borders.
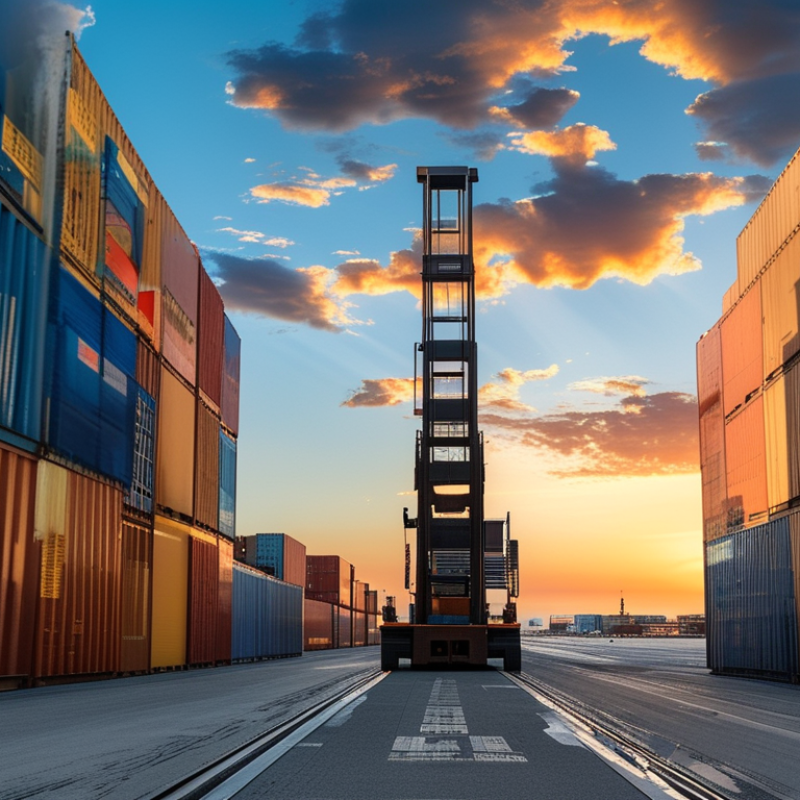
Global logistics solutions connect suppliers, warehouses, carriers, and customers across borders. They include shipment planning, freight booking, inventory control, customs documentation, and delivery tracking. A practical provider studies product size, destination, deadlines, and handling needs before selecting transport. This reduces empty space, avoidable delays, and unexpected storage costs. The process should remain visible, with updates showing when goods leave a facility and reach a checkpoint.
Warehousing is another important part. Goods may need receiving, labeling, secure storage, order picking, and careful packing. Temperature-sensitive products require monitored conditions and documented checks. International shipments also need accurate invoices, classification details, and origin information. Experienced logistics teams review these records because small errors can hold cargo for days. No system is flawless. A missed scan can still happen, so clear escalation procedures and human follow-up matter.
Tips: Compare delivery promises with real tracking performance. Ask how damaged cartons, address changes, and delayed customs inspections are handled. Keep product data consistent across invoices and shipping systems. It helps to test one route before expanding globally. Review the results honestly, including failed deliveries and extra fees. That uncomfortable review often reveals weak handoffs, unclear responsibilities, or unrealistic timelines. Choose measurable service standards, such as response times, inventory accuracy, and proof-of-delivery requirements.

Global logistics networks operate through connected handoffs, not one giant system. A shipment may leave a factory by truck, cross an ocean, clear customs, and reach a regional warehouse by rail. Each transfer depends on accurate documents, reliable schedules, and shared shipment data.
UNCTAD’s Review of Maritime Transport reports that over 80% of global merchandise trade by volume moves by sea.
That figure explains why port capacity, weather, and congestion can affect a small delivery several continents away.
Strong logistics providers coordinate carriers, warehouses, customs teams, and local transport partners through one operating plan.
The World Bank’s 2023 Logistics Performance Index evaluates 139 economies across customs, infrastructure, international shipments, logistics competence, tracking, and timeliness.
These measures reveal an important reality: speed alone is not enough.
A fast vessel cannot repair missing paperwork.
A modern warehouse cannot solve poor last-mile planning.
In practice, teams should track milestone scans, temperature readings, inventory counts, and exception alerts before problems become expensive.
Data helps, but it is not perfect. A dashboard may show movement while a container waits outside a congested terminal. That gap deserves investigation.
Businesses should compare planned and actual transit times, review carrier performance, and keep backup routes for critical goods.
The process can feel less elegant than expected. It is still more dependable when every handoff has an owner, a timestamp, and a documented response.
Global logistics solutions can strengthen business supply chains by connecting suppliers, warehouses, carriers, and customers through one coordinated process. A shipment may leave a factory in Vietnam, pass through a European distribution center, and reach a retailer within days. Clear tracking shows where delays begin. It also gives managers evidence for practical decisions.
Experienced logistics teams study transport capacity, seasonal demand, customs requirements, and warehouse performance before selecting routes. They compare delivery records, not just quoted prices. This approach can reduce stockouts and prevent unnecessary storage costs. Accurate documentation matters too. A missing invoice or incorrect product description can hold a shipment for days.
Reliable partners also build contingency plans for weather, port congestion, and supplier interruptions. However, no plan works perfectly. Forecasts can fail, tracking data can arrive late, and local conditions may change without warning. Human review remains necessary, especially when several countries and handoffs are involved. Businesses should regularly examine delivery times, damage reports, inventory accuracy, and customer complaints. These details reveal weak points that impressive dashboards may hide.
The strongest supply chain is not always the fastest one. It is the one that balances speed, cost, visibility, compliance, and realistic operating limits. That balance helps companies serve customers consistently while adapting when conditions shift.
Choosing a global logistics provider requires more than comparing freight rates. In practice, reliability often matters more than a small price difference.
The World Bank’s 2023 Logistics Performance Index reports that shipments take about 44 days from port entry to final destination. That period represents nearly 60% of total shipping time.
Ask providers how they measure delays, handover times, and customs performance. Require shipment-level tracking, named escalation contacts, and documented recovery procedures. Clear evidence beats confident promises.
Network depth also deserves close review.
UNCTAD’s Review of Maritime Transport 2023 estimates that over 80% of global merchandise trade moves by sea. A provider should offer realistic alternatives when ports close or capacity tightens.
Examine warehouse locations, carrier relationships, customs knowledge, and compliance controls. Check whether their systems protect commercial data and support accurate documentation.
Request references from businesses with similar products and destinations. Test their reporting before signing. Small gaps become expensive quickly.
Cost still matters. However, the cheapest quote may exclude storage, inspections, fuel adjustments, or delivery failures.
Compare total landed cost, insurance terms, claims handling, and service-level penalties. Sustainability reporting should include measurable emissions methods, not vague promises.
No provider is perfect. Our evaluation process should not be perfect either.
Recheck assumptions quarterly, especially after seasonal peaks or regulatory changes. That discipline can reveal weak routes before customers do.
Choosing a global logistics solution requires more than a low freight quote. In practice, the cheapest offer may exclude fuel adjustments, customs handling, storage, or remote-area delivery. Request an itemized estimate for every route and shipment type. Compare identical assumptions: pallet size, weight, insurance, transit window, and delivery location. Ask how often charges change. A clear rate sheet builds trust. Hidden fees do not.
Technology should make decisions easier, not decorate a sales presentation. Look for live milestone tracking, electronic documents, inventory visibility, and exception alerts. Test the system with a sample shipment. Can a manager find a delayed container in under two minutes? Does it show local time, updated estimates, and the reason for a delay? Integration with order and warehouse systems reduces duplicate typing. Still, no dashboard replaces human judgment. Data can lag.
Service quality appears when plans break. Ask for named contacts, escalation rules, response targets, and after-hours coverage across time zones. Request performance evidence, such as on-time delivery, claim resolution, and damage rates. Speak with customers when possible. A reliable provider explains limitations without defensive language. During a pilot, send a small batch and record every handoff. Review the results honestly. One missed update may reveal a weak process, but one mistake alone should not define the partnership.
| Evaluation Area | Key Metric | How to Calculate or Verify | Practical Benchmark | Business Value |
|---|---|---|---|---|
| Cost | Total landed cost | Freight + fuel surcharge + handling + customs + duties + insurance + storage + delivery fees | Request an all-in quote with every surcharge listed separately | Prevents low headline rates from becoming expensive final invoices |
| Cost | Quote validity | Number of calendar days that the quoted price remains valid | At least 7 days for standard international shipments; confirm validity for volatile lanes | Improves budgeting and reduces unexpected rate changes |
| Cost | Invoice accuracy | Correct invoices ÷ total invoices × 100 | Target at least 98% accurate invoices | Reduces reconciliation time and payment disputes |
| Cost | Cost per shipment or order | Total logistics spend ÷ number of completed shipments or customer orders | Compare the same origin, destination, Incoterm, mode, weight, and service level | Creates a fair comparison between proposals |
| Technology | Shipment visibility | Check whether milestones include booking, pickup, departure, arrival, customs, out-for-delivery, and proof of delivery | Event updates for at least 90% of planned shipment milestones | Allows earlier intervention when delays occur |
| Technology | Tracking update frequency | Measure the time between operational events and system updates | Event-based updates within 4 hours for normal movements; immediate alerts for exceptions | Improves customer communication and inventory planning |
| Technology | System availability | Monthly available system time ÷ total monthly time × 100 | A service-level target of 99.9% monthly availability | Keeps tracking, booking, and reporting accessible during business operations |
| Technology | Integration capability | Verify API, EDI, CSV, webhooks, authentication, documentation, and testing support | At least one documented API or EDI option plus exportable shipment data | Reduces manual data entry and duplicate records |
| Technology | ETA accuracy | Shipments delivered within the promised ETA window ÷ total delivered shipments × 100 | Set a lane-specific target; 85% or higher is a useful starting threshold for review | Supports reliable replenishment and customer delivery promises |
| Service Quality | On-time, in-full delivery | Shipments delivered by the promised date with the complete quantity ÷ total shipments × 100 | Target at least 95%, with separate targets for each trade lane | Protects customer satisfaction and reduces stockout risk |
| Service Quality | Damage and loss rate | Damaged or lost shipments ÷ total shipments × 100 | Target below 1%; review packaging, handling, and route-specific results | Limits replacement costs, claims, and customer complaints |
| Service Quality | First-response time | Average time from a support request or exception alert to the first meaningful response | Within 4 business hours for standard cases; faster for critical exceptions | Speeds up problem resolution and limits operational disruption |
| Service Quality | Claims resolution time | Average calendar days from complete claim submission to final decision | Target a documented process with a decision within 15 business days | Improves cash recovery and clarifies accountability |
| Compliance | Documentation accuracy | Shipments with complete and correct commercial, customs, and transport documents ÷ total shipments × 100 | Target at least 99% complete documentation before dispatch | Reduces customs delays, penalties, and border holds |
| Scalability | Capacity flexibility | Compare normal, peak-season, and emergency capacity commitments | Documented peak-season plan, backup routing, and escalation contacts | Maintains continuity when demand or capacity changes |
Benchmark figures are planning targets rather than guaranteed market rates. Compare results by trade lane, transport mode, product category, Incoterm, shipment size, and service level.